Tracing
Restate supports the following tracing features:
- Runtime execution tracing per invocation
- Exporting traces to OTLP-compatible systems (e.g. Jaeger)
- Correlating parent traces of incoming HTTP requests, using the W3C TraceContext specification.
Setting up OTLP exporter
Set up the OTLP exporter by pointing the configuration entry tracing-endpoint to your trace collector.
Exporting traces to Jaeger
Jaeger accepts OTLP trace data on port 4317.
Start Jaeger locally with Docker, for example:
docker run -d --name jaeger \-p 4317:4317 -p 16686:16686 \jaegertracing/jaeger:2.4.0
Configure the tracing endpoint in Restate as a fully specified URL:
restate-server --tracing-endpoint http://localhost:4317
If you run Restate in Docker, then instead add the environment variable -e RESTATE_TRACING_ENDPOINT=http://host.docker.internal:4317.
Specifying additional tracing headers
You can specify additional headers to be sent with the trace data by setting the tracing-headers configuration entry.
For example, to specify an authorization header add the following snippet to the configuration file:
[tracing-headers]authorization = "Bearer some-auth-token"
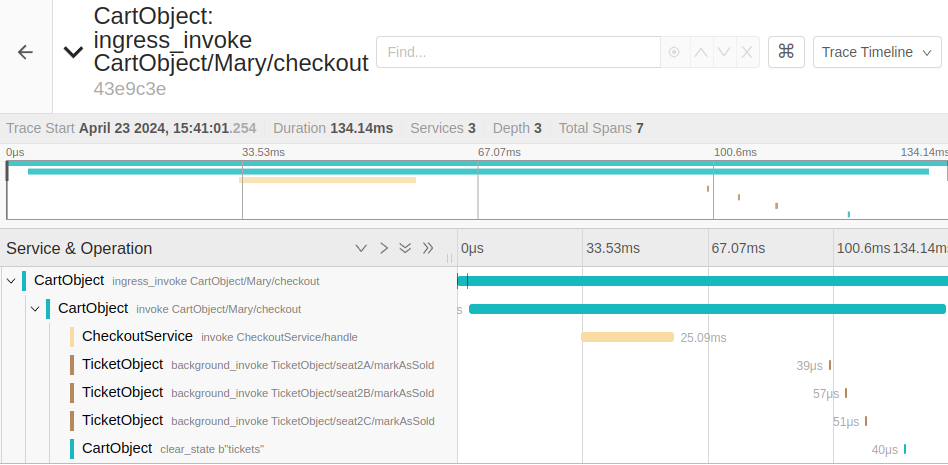
If you now spin up your services and send requests to them, you will see the traces appear in the Jaeger UI at http://localhost:16686:

You can configure a span/event filter in a similar fashion to the log filter setting the tracing-filter configuration entry.
Setting up Jaeger file exporter
If you can't configure a Jaeger agent, you can export traces by writing them to files, using the Jaeger JSON format.
To do so, set up the configuration entry tracing-json-path pointing towards the path where trace files should be written.
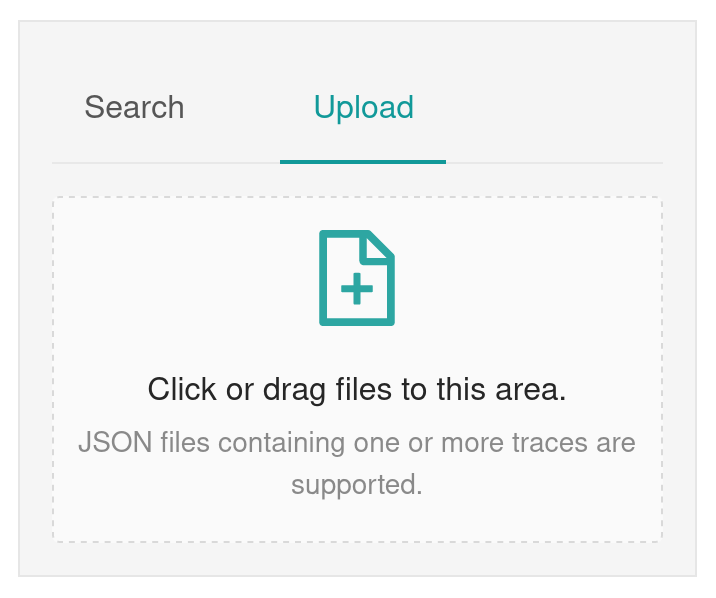
You can import the trace files using the Jaeger UI:

Understanding traces
The traces contain detailed information about the context calls that were done during the invocation (e.g. sleep, one-way calls, interaction with state):

The initial ingress_invoke spans show when the HTTP request was received by Restate. The invoke span beneath it shows when Restate invoked the service deployment to process the request.
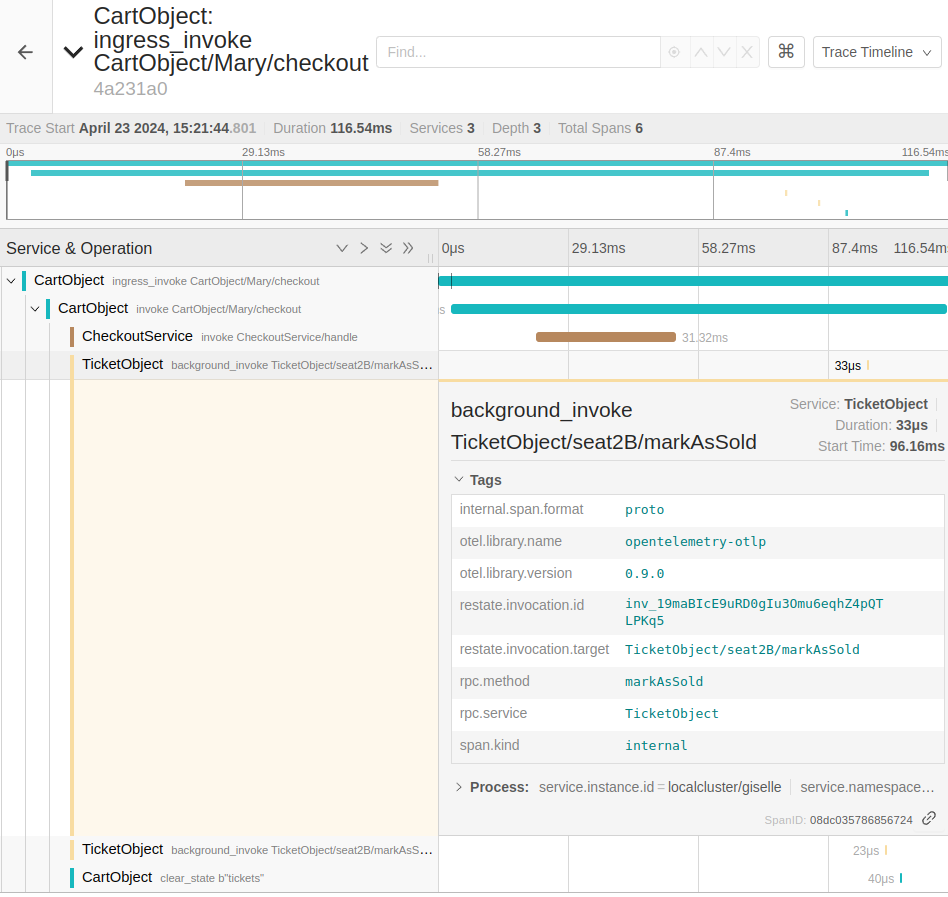
The tags of the spans contain the metadata of the context calls (e.g. call arguments, invocation id).
When a service invokes another service, the child invocation is linked automatically to the parent invocation, as you can see in the image.
Note that the spans of one-way calls are shown as separate traces. The parent invocation only shows that the one-way call was scheduled, not its entire tracing span.
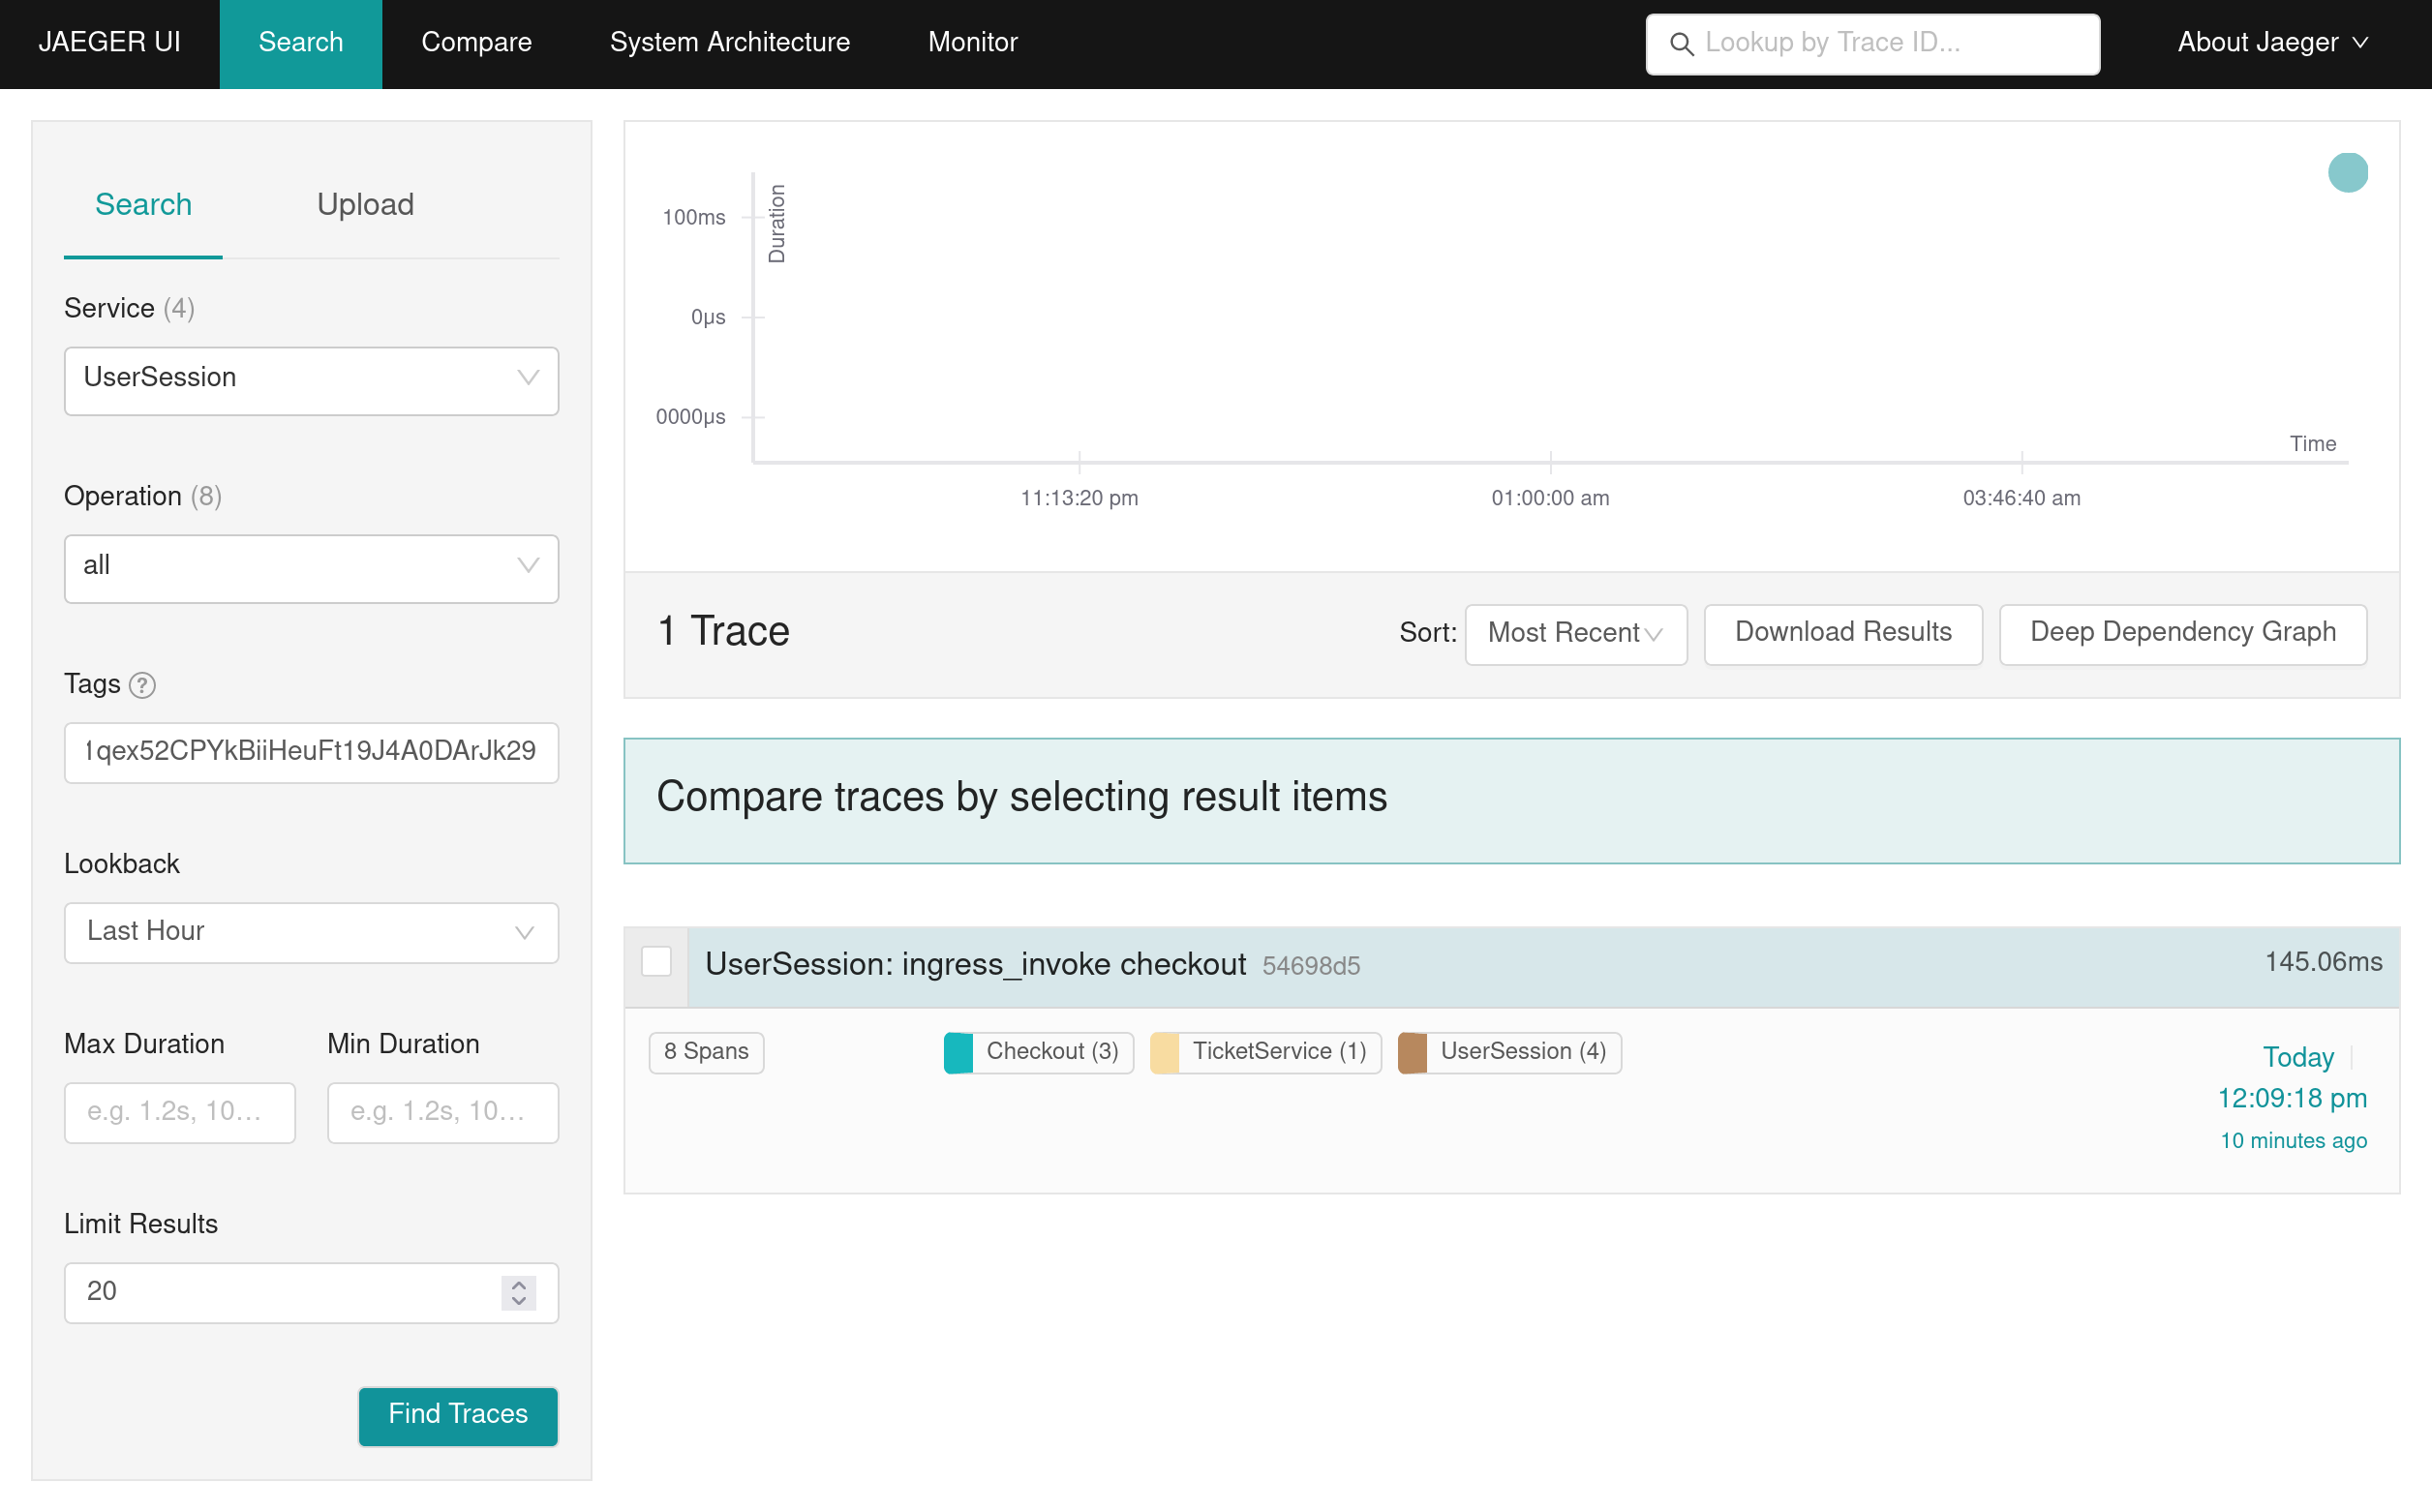
To see this information, search for the trace of the one-way call by filtering on the invocation id tag restate.invocation.id="inv_19maBIcE9uRD0gIu30mu6eqhZ4pQT".
Searching traces
Traces export attributes and tags that correlate the trace with the service and/or invocation. For example, in the Jaeger UI, you can filter on the invocation id (restate.invocation.id) or any other tag:
